Business Analytics for Home Inspectors
Know exactly how your inspection business is performing. Track revenue trends, see which services are most profitable, and identify your best referral sources. Make decisions based on data, not guesses.
 Real-Time Data
Stop Flying Blind
Most inspectors have no idea which parts of their business actually make money.
No Revenue Visibility
How much did you make last month? Which week was best? If you have to pull out a calculator, you're not running a business - you're hoping.
Unknown Referral Value
Which agents send you the most business? Which ones are worth a thank-you gift? Without data, you're just guessing who matters.
Spreadsheet Chaos
Tracking everything in Excel takes hours. By the time you compile reports, the data is stale. You need insights now, not next week.
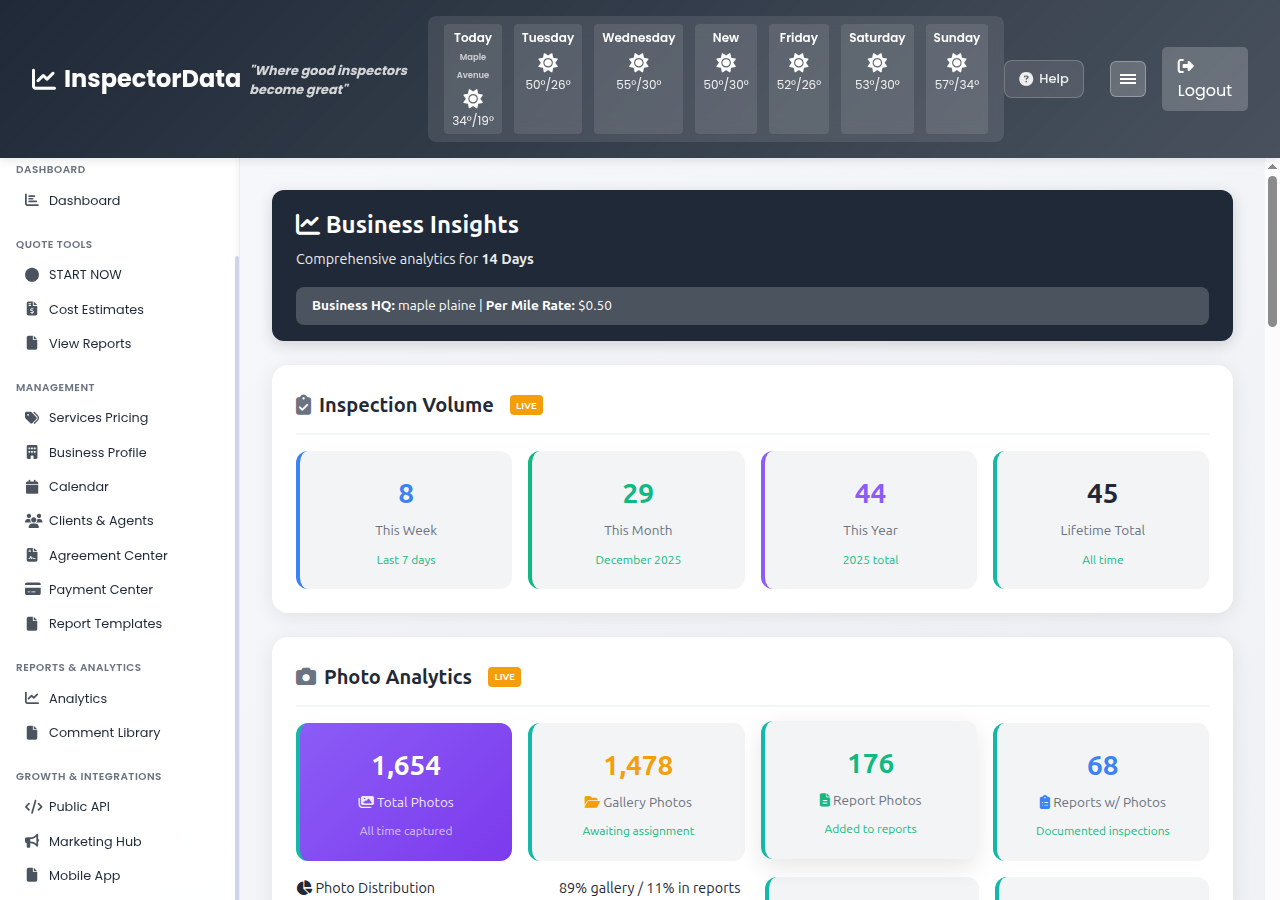
Your Business Performance at a Glance
Open your dashboard and instantly see how your business is doing. Revenue trends, inspection counts, average invoice values, and more - all updated in real-time. No spreadsheets. No manual calculations.
- Revenue Tracking - Daily, weekly, monthly, and yearly revenue at a glance.
- Inspection Counts - See how many inspections you've completed over any time period.
- Average Invoice Value - Know if you're pricing right by tracking average transaction size.
- Year-Over-Year Comparison - Is your business growing? See the trend clearly.
Analytics Features
Everything you need to understand and grow your inspection business.
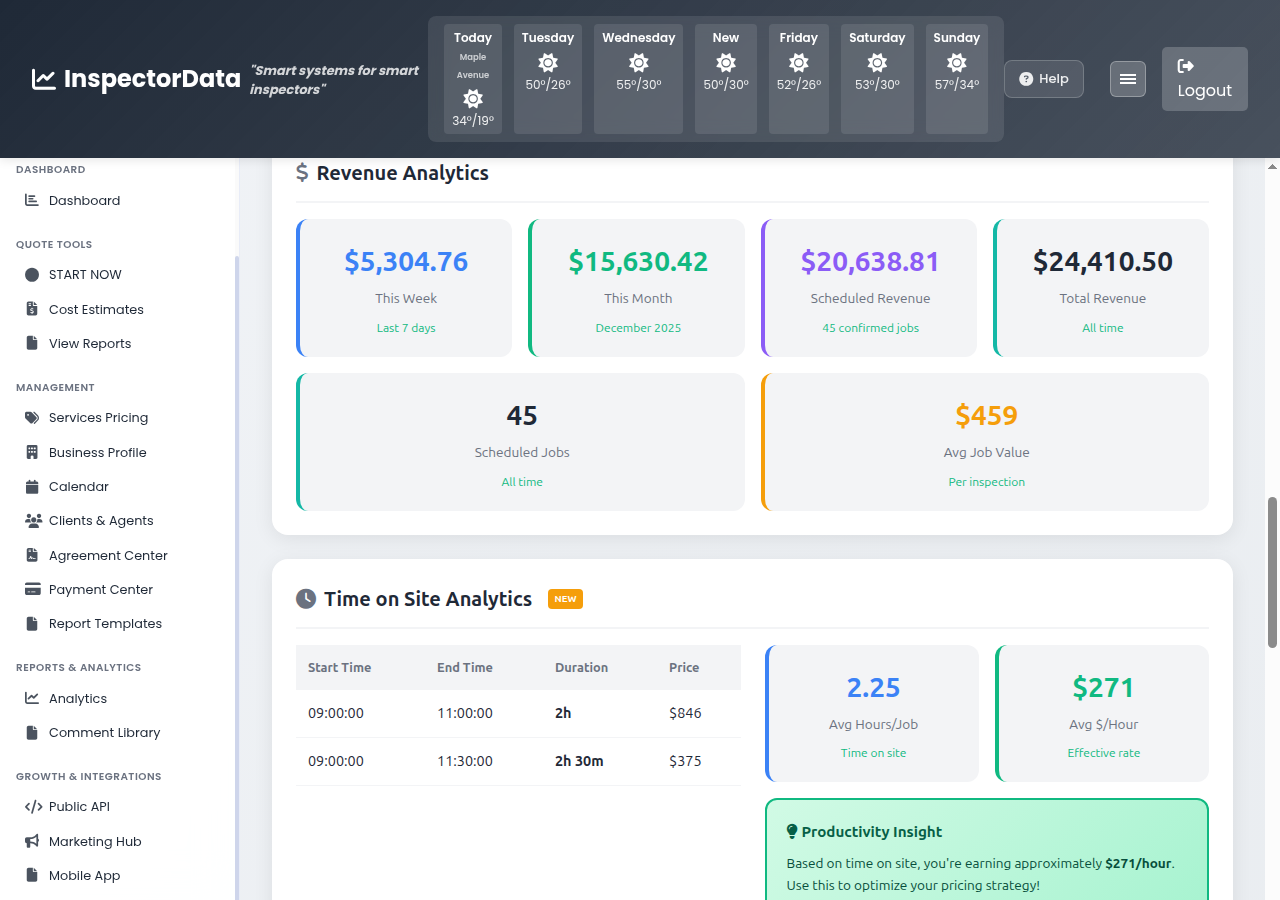
Revenue Reports
Track income by day, week, month, or custom date range. Export for your accountant at tax time.
Service Breakdown
See which services generate the most revenue. Know which add-ons are worth promoting.
Agent Performance
Track referrals by real estate agent. See who sends you business and who doesn't.
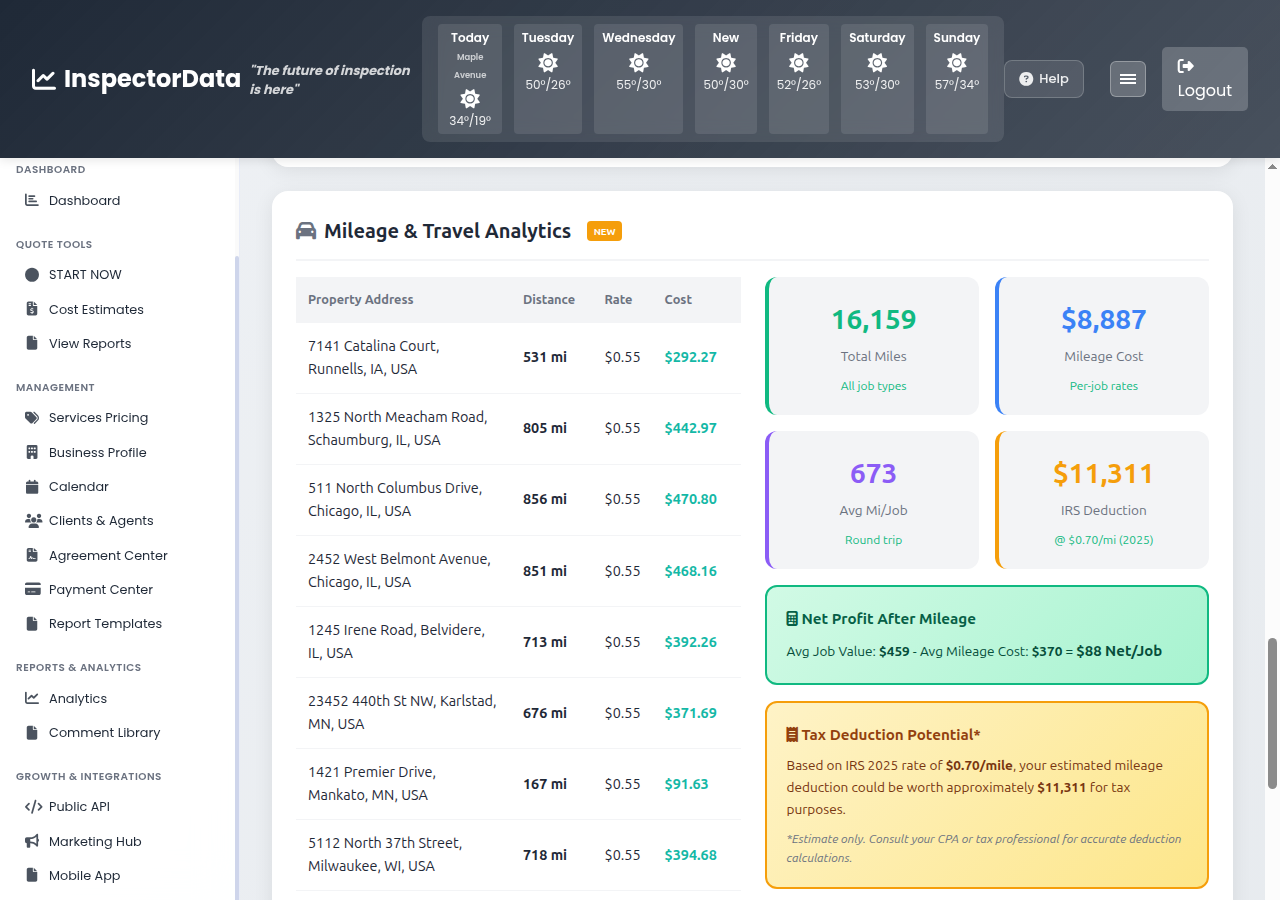
Geographic Insights
See where your inspections are concentrated. Identify underserved areas worth marketing to.
Scheduling Patterns
Discover your busiest days and times. Optimize your availability for maximum bookings.
Export Everything
Download any report as PDF or CSV. Share with partners, accountants, or lenders.
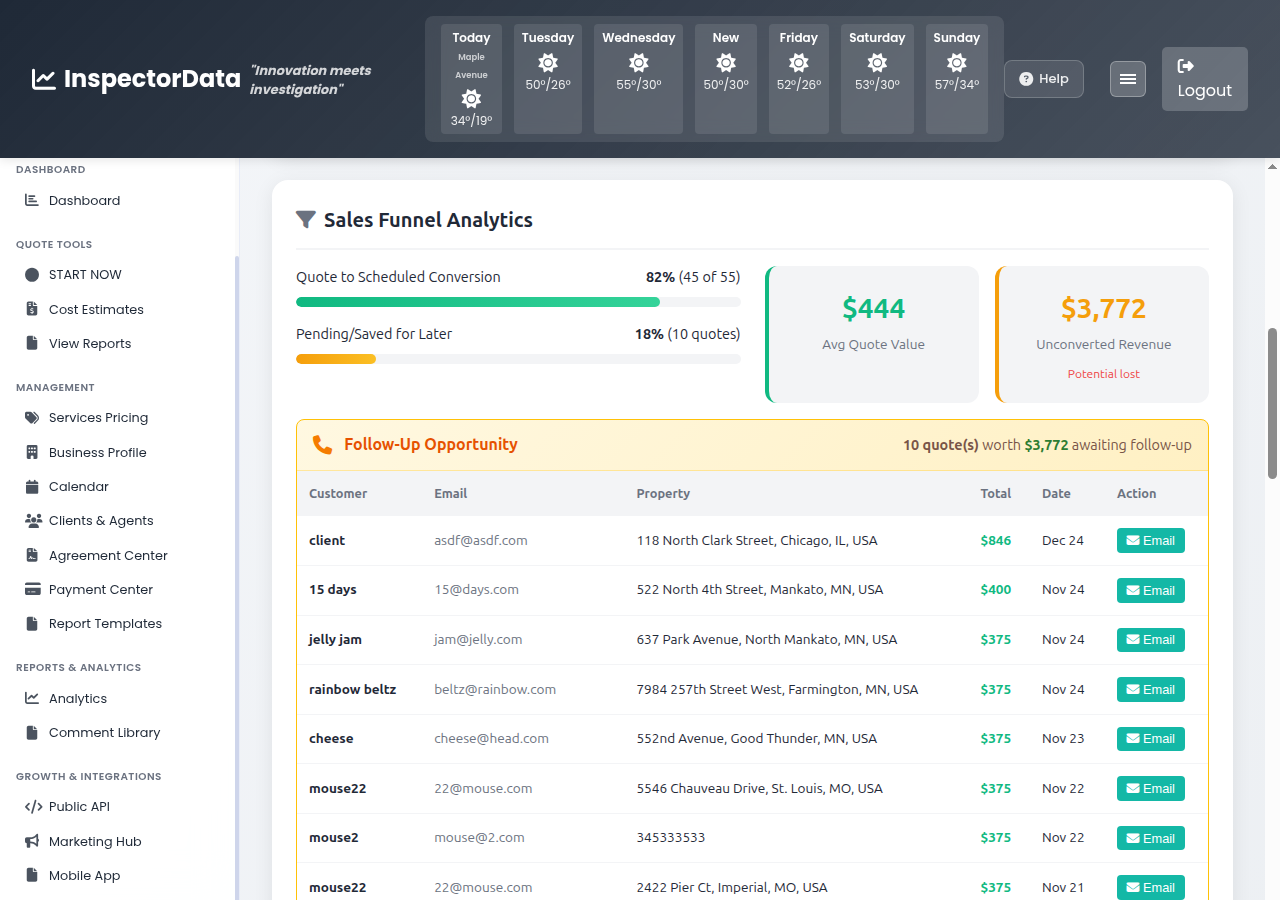
Know Your Best Referral Sources
Some agents send you business every month. Others used you once and forgot your name. Our referral analytics show you exactly who deserves your attention and who doesn't.
- Agent Leaderboard - See your top referrers ranked by inspection count and revenue.
- Brokerage Breakdown - Which real estate offices send the most business overall?
- Referral Trends - Are certain agents sending more or less business over time?
- Revenue Per Referrer - Know the dollar value of each agent relationship.
Understand Your Service Mix
Which services make you the most money? Are radon tests worth promoting? Should you push sewer scopes harder? Our service analytics show you exactly where your revenue comes from.
- Revenue by Service - See which inspection types generate the most income.
- Add-On Attachment Rate - How often do customers add ancillary services?
- Pricing Analysis - Are you charging enough? See average prices across services.
- Seasonal Trends - Which services spike in certain seasons?
Built by InterNACHI Certified Inspectors
We built the analytics we wished we had when running our own inspection businesses. Focused on the metrics that actually matter for growing an inspection company.
Make Data-Driven Decisions
Stop guessing. Start knowing. Free 14-day trial, no credit card required.
Frequently Asked Questions
What business metrics does InspectorData track?
InspectorData tracks revenue, inspection volume, average inspection fee, agent referral performance, booking conversion rates, seasonal trends, and growth metrics to help you make data-driven business decisions.