You can't improve what you don't measure. Yet most home inspectors run their business entirely by feel — they know roughly how many inspections they do per week and roughly what their bank balance looks like. That's not a business; it's a job with paperwork. The inspectors building real, scalable businesses track 10–15 specific numbers every month and use those numbers to make every important decision.
Why Most Inspectors Don't Track Their Business
The honest reason: tracking feels like extra work when you're already busy doing inspections and writing reports. But the math is simple — spending 2 hours per month on your numbers can reveal $10,000–$50,000 in hidden revenue opportunities or losses you didn't know were happening.
Revenue KPIs: Are You Growing?
KPI 1: Monthly Recurring Revenue (MRR)
What it is: Total revenue for the month from all inspection services.
Why it matters: The baseline measure of business health and growth trajectory.
How to calculate: Sum of all invoices paid in the month.
| Business Stage | Monthly Revenue Target | Annual Revenue Target |
|---|---|---|
| Year 1 (building) | $4,000–8,000/month | $48,000–96,000 |
| Established solo | $8,000–15,000/month | $96,000–180,000 |
| High-volume solo | $15,000–22,000/month | $180,000–265,000 |
| Multi-inspector (2) | $20,000–35,000/month | $240,000–420,000 |
| Multi-inspector (3+) | $35,000+/month | $420,000+ |
KPI 2: Average Revenue Per Inspection (ARPI)
What it is: Total monthly revenue ÷ total inspections completed.
Why it matters: Tracks whether you're capturing add-on services and pricing correctly.
Benchmarks: $250–350 (starter), $350–450 (established), $450–600+ (premium/add-on seller).
KPI 3: Month-Over-Month Revenue Growth Rate
What it is: (This month's revenue – Last month's revenue) ÷ Last month's revenue × 100.
Target: 5–15% month-over-month during growth phase; +5% year-over-year when mature.
Red flag: Negative growth for 2+ consecutive months demands investigation.
KPI 4: Revenue by Service Type
What it is: Breakdown of revenue by inspection type (standard, radon, sewer, mold, etc.).
Why it matters: Identifies which add-on services are growing and which to promote more.
Action: If an add-on service has high revenue but low volume, train clients to ask for it at booking.
Efficiency KPIs: Are You Profitable?
KPI 5: Profit Margin
What it is: (Revenue – Expenses) ÷ Revenue × 100.
Target: 40–60% net margin for a solo inspector is achievable; 30–45% for a multi-inspector firm.
| Expense Category | % of Revenue (Solo) | % of Revenue (Multi) |
|---|---|---|
| Payroll / Owner draw | 50–60% | 45–55% |
| Insurance (E&O + GL) | 3–6% | 2–4% |
| Software & tools | 1–3% | 1–2% |
| Marketing | 3–8% | 2–5% |
| Vehicle/fuel | 3–6% | 2–4% |
| Continuing education | 1–2% | 0.5–1% |
| Other operating costs | 2–5% | 3–8% |
KPI 6: Inspections Per Day
What it is: Average number of inspections completed per working day.
Benchmarks: 1/day (new), 1.5/day (established), 2/day (efficient/optimized).
How to improve: Zone scheduling, optimized report templates, same-market clustering.
KPI 7: Report Turnaround Time
What it is: Average time from inspection completion to report delivery.
Benchmarks: Under 4 hours (excellent), 4–8 hours (good), 8–24 hours (acceptable), 24+ hours (needs improvement).
Impact: Faster reports directly correlate with agent satisfaction and repeat referrals.
KPI 8: No-Show and Cancellation Rate
What it is: Number of cancellations/no-shows ÷ total bookings × 100.
Target: Under 5% cancellation rate; under 2% no-show rate.
Benchmark cost: Every 1% no-show rate on 250 annual inspections = 2.5 lost inspections = $625–$1,000 in lost revenue.
Marketing KPIs: Where Are Clients Coming From?
KPI 9: Referral Source Distribution
What it is: Percentage of bookings from each source (agents, past clients, Google, etc.).
Why it matters: Diversification prevents catastrophic revenue loss if one channel dries up.
| Referral Source | Healthy Mix | Dangerous Concentration |
|---|---|---|
| Agent referrals | 50–65% | Over 80% (too dependent) |
| Past clients | 10–20% | Under 5% (no repeat/referral system) |
| Google/SEO | 10–20% | Under 3% (missed opportunity) |
| Direct/brand | 5–15% | — |
| Other/paid | 5–10% | Over 30% (too expensive) |
KPI 10: Cost Per Acquisition (CPA)
What it is: Total marketing spend ÷ new clients acquired from that channel.
Targets: Agent referrals ($0–5), Google organic ($0–20), Google Ads ($30–80), Zillow ($40–120).
Action: Any channel with CPA above $100 needs serious evaluation.
Quality KPIs: Are Clients Happy?
KPI 11: Google Review Score and Volume
What it is: Current Google rating and review count growth rate.
Targets: 4.8+ rating; add 3–5 new reviews per month.
Impact: Moving from 4.2 to 4.8 on Google can increase click-through rate by 25–35%.
KPI 12: Net Promoter Score (NPS)
What it is: Ask clients "How likely are you to recommend us? (0–10)." Score = % Promoters (9–10) – % Detractors (0–6).
Targets: NPS 50+ is good; 70+ is excellent.
How to collect: Simple one-question email survey sent 24 hours after report delivery.
Benchmark Targets by Business Stage
| KPI | Year 1 | Year 2–3 | Year 4+ (Optimized) |
|---|---|---|---|
| Monthly revenue | $4,000–8,000 | $8,000–15,000 | $15,000–22,000+ |
| ARPI | $250–300 | $300–400 | $400–550+ |
| Profit margin | 30–40% | 40–50% | 50–60% |
| Inspections/day | 1.0 | 1.3–1.5 | 1.7–2.0 |
| Report turnaround | 8–12 hours | 4–8 hours | Under 4 hours |
| No-show rate | 5–10% | 3–5% | Under 2% |
| Google rating | 4.5+ | 4.7+ | 4.8+ |
| Review count | 20–50 | 50–150 | 150+ |
Building Your Monthly KPI Dashboard
Your KPI dashboard doesn't need to be sophisticated. A simple spreadsheet updated at the end of each month is enough to start. Here's a practical structure:
1. Pull numbers from your inspection management system and accounting software (30 min)
2. Update your KPI spreadsheet with current month data (15 min)
3. Compare to previous month and same month last year (15 min)
4. Identify top 2 KPIs to focus on improving next month (15 min)
5. Write down one specific action for each improvement target (15 min)
Minimum Viable KPI Tracking (Start Here)
If you're new to tracking, start with just these 5 monthly numbers:
- Total revenue
- Number of inspections
- Average revenue per inspection
- New Google reviews this month
- Top referral source (agent name or channel)
These 5 numbers tell you 80% of what you need to know. Add more metrics as tracking becomes habit.
When to Act on What You See
| What You See | What It Means | Immediate Action |
|---|---|---|
| Revenue flat for 3 months | Market saturation or marketing failure | Add new referral source or service |
| ARPI declining | Discounting too much or skipping add-on pitch | Price audit + add-on training |
| No-shows above 5% | Booking process lacks commitment mechanism | Add deposit requirement |
| One agent = 40%+ of revenue | Dangerous dependency | Aggressively add 5 new agents |
| Reviews stalled | Not asking systematically | Automate review request sequence |
| Report time creeping up | Process inefficiency or volume overload | Review template + workflow |
| Margin under 35% | Expense bloat or underpricing | Expense audit + price increase |
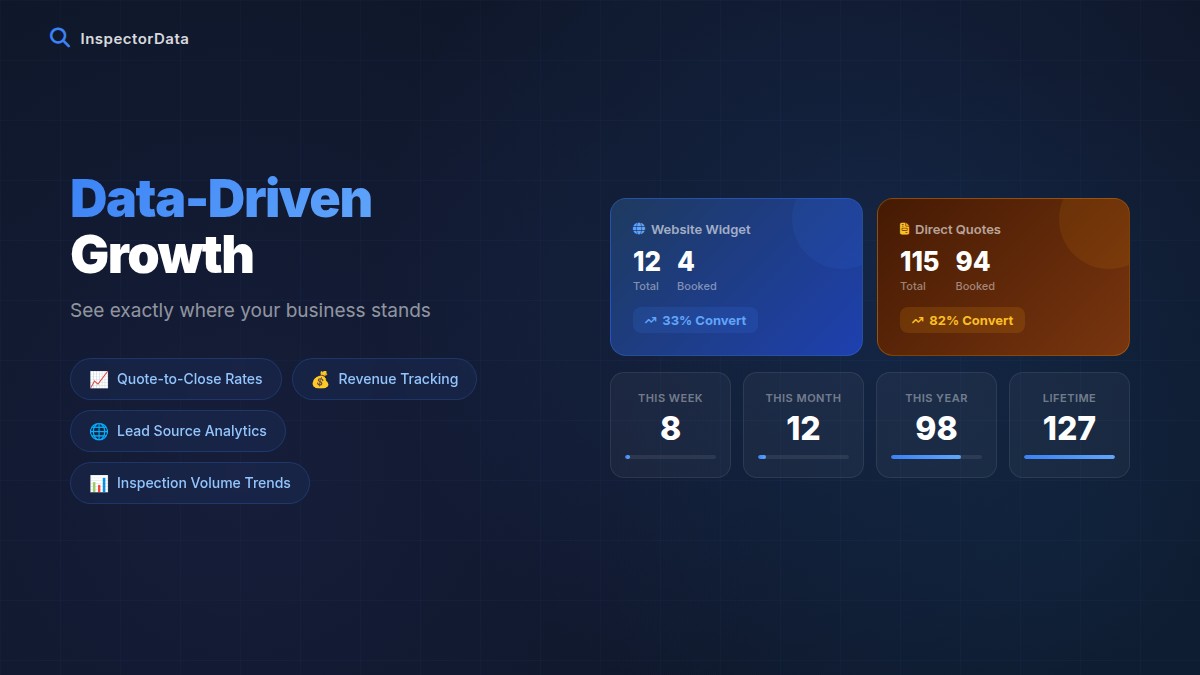
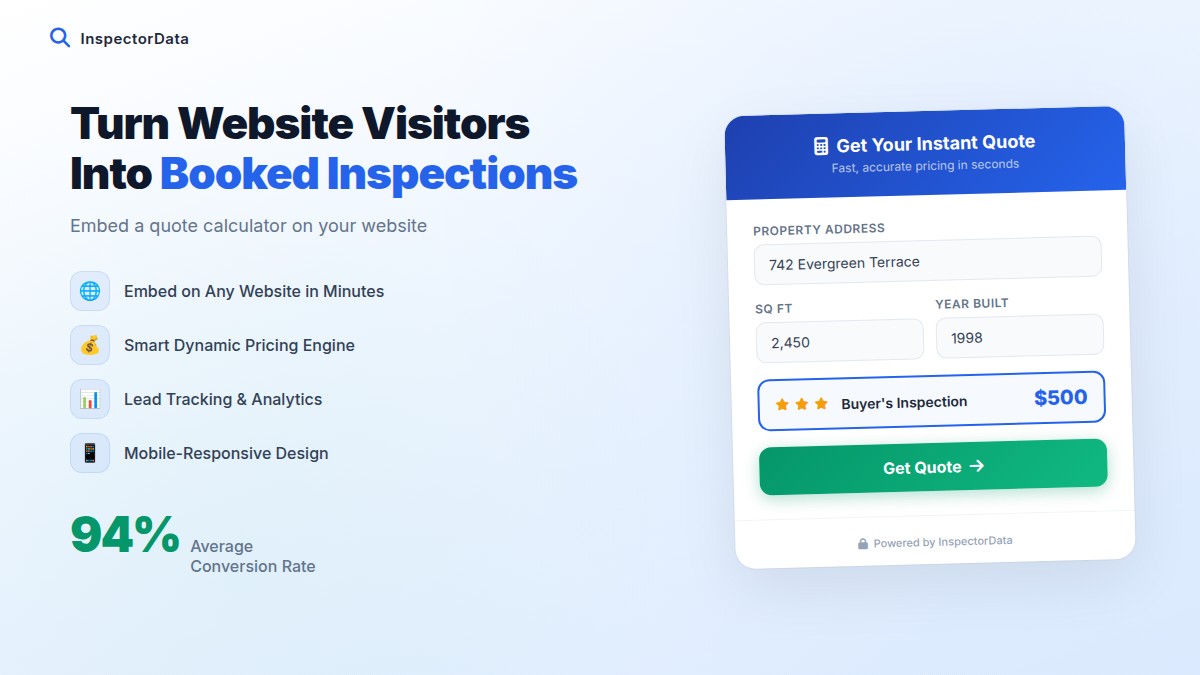
Track Your Business Like a Pro
InspectorData makes it easy to see your inspection volume, revenue, and performance in one dashboard. Stop flying blind — know exactly what's working and what needs attention.
Try InspectorData Free for 90 DaysNo credit card required. Set up in 10 minutes.